WhatsApp
9308654075
Courses
- Web Development
- Data Analytics
- Data Science with Gen AI
- Cyber Security
- Python
- Django
- C Language
- C++
- Java Training
- Data Structure
- Algorithm
- Front-end Development
- JavaScript, jQuery & Ajax
- React.js
- Node.js & Express.js
- MySQL
- SQL
- PL/SQL
- Oracle
- MongoDb
- SQLITE
- ADCAT
- ADCA
- DCA
- Tally Prime
- Advance Excel
- COA
- ADOA
- GST
- TAT
- TDS & Payroll
Data Science with Gen AI
Internet is growing exponentially and so are businesses. Doing business in the era of digitisation is easy but making its strategy, analysing the data, forecasting the future, comparative analysis with the competitors' reports is not a layman's task. So why spend crores of rupees and sleepless nights evaluating all. Use Data Science get the work done at a lesser cost and smaller duration.
From fraud detection to weather forecasting, company's decision making to forecasting the future, everything is Data Science' game.
This is a combination of maths and programming, advanced analytics, Artificial Intelligence and Machine Learning which makes the calculations and forecasts readily available for the end users.
Learn Big Data, AI and ML under one umbrella i.e Data Science and become a Data Scientist.
| Course Name | Date & Time | Take Demos |
|---|---|---|
| Core Java | 03/06/2024 | View Details |
| User Interface(UI) | 03/06/2024 | View Details |
| React.js | Starting Soon... | View Details |
| MySQL | Starting Soon... | View Details |
| ADCAT | Starting Soon... | View Details |
Why Data Science?
- AI and ML: Artificial Intelligence and Machine Learning is the new future.
- No Technical Background Required: You must need not be a scientist or an engineer to learn the Data Science. Anyone can become the Data Scientist, who wants to foresee the future.
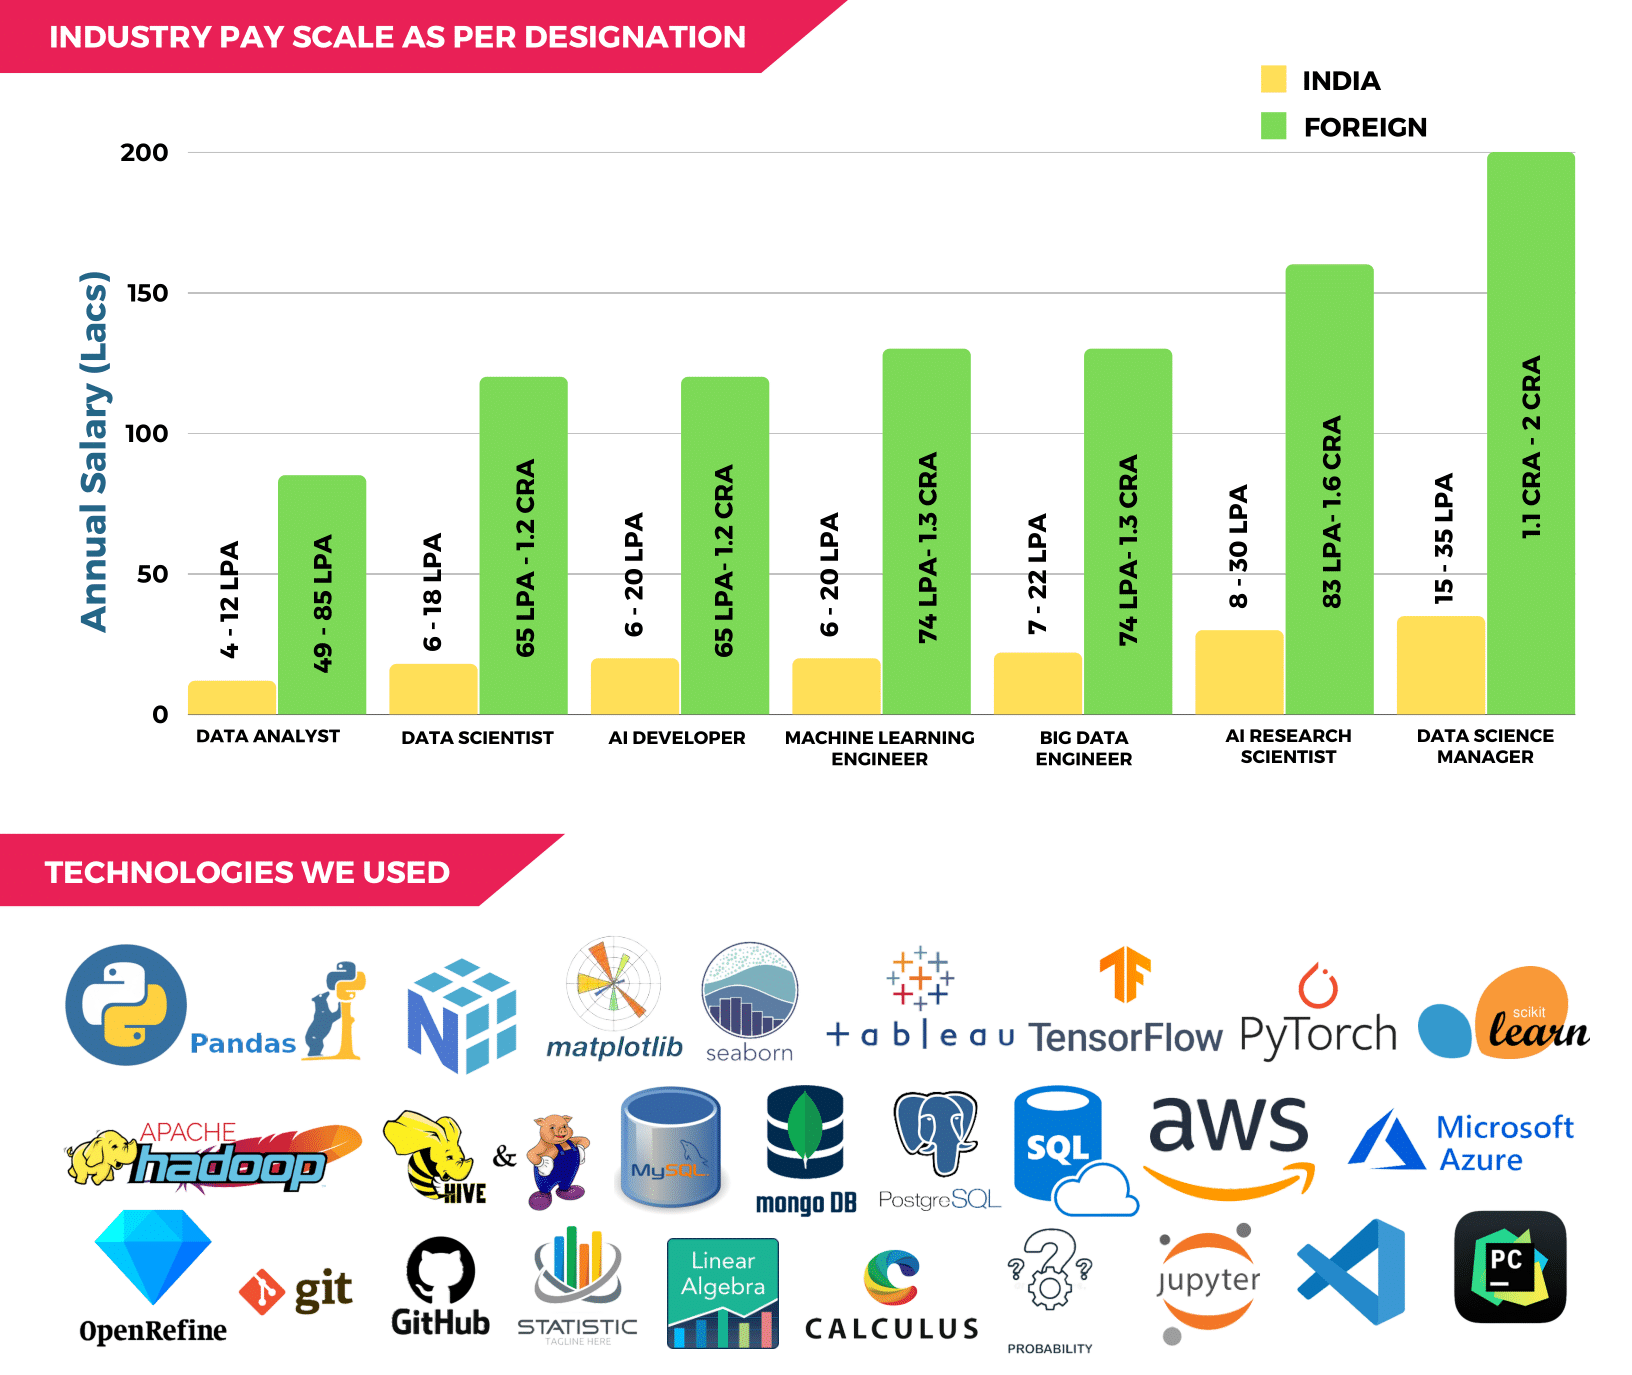
- High Market Demand: Data Scientist' job is one of the most demanded and is highly paid jobs in the industry. Almost all the sectors of the industry uses it.
WHY REPL?
- Life time validity (enroll one time and revise many times)
- Interaction with the best faculty and Industry Experts
- Small Batches to focus on each student
- We focus on both theoretical and practical approaches in a parallel way.
- You will be given the opportunity to work on a live project.
- Outdoor activities to boost your confidence.
- Presentation in class by the students.
Our Key Features:
- Good Quality Material Notes
- Smart Classes Available
- Online Test
- Chapter wise Assignments
- Offline And Online Classes
- Recorded class on Rays App
- Eminent faculties of the IT Industry( Amazon, Wal-Mart, Oracle, Microsoft..)
- Fully AC and Wi-Fi Campus.
Python and Libraries
Data Visualization
Math & Statistics
Database
Machine Learning
Deep Learning
Natural Language
Processing (NLP)
Processing (NLP)
Control Version
Python & Libraries
- Variables
- Data types
- Operators
- if statements
- Loops
- String
- Lists, Tuples
- Dictionaries
- Sets
- Conditional expressions
- Modules
- Functions
- File handling
- Object Oriented Concept
- Exception Handling
- GUI Progragramming in Python
- 5 Mini Projects
- Introduction to Pandas
- Series and DataFrames
- Data Exploration
- Data Manipulation
- Data Cleaning
- Grouping and Aggregation
- Data Visualization with Pandas
- Time Series Data
- Handling Categorical Data
- Reading and writing data to various file formats: CSV, Excel, JSON,SQL Database
- Introduction to NumPy
- NumPy Arrays and Operations
- Linear Algebra with NumPy
- Data Processing with NumPy
- NumPy and Statistics
- NumPy and Visualization
- NumPy and Machine Learning
Data Visualization
- Basic Formulas: SUM, AVERAGE, MEAN, MEDIAN, SUMPRODUCT, CONCATENATE
- Advance Formulas: VLOOKUP, INDEX, MATCH, IF, COUNTIF, SUMIF, Remove duplicates and conditional formatting
- Charts & Filters: Charts, filters, sort and slicers, Pivot tables and pivot charts
- Introduction to Matplotlib
- Basic Plotting with Matplotlib
- Different Types of Plots
- Advanced Plot Customization
- 3D Plotting
- Working with Images
- Animations
- Integration with Pandas and NumPy
- Introduction to Seaborn
- Seaborn Plots
- Customizing Plots
- Statistical
- Estimation and Visualization
- Data Exploration and Analysis
- Advanced Visualization Techniques
- Working with Time Series Data
- Integration with Pandas and NumPy
- Introduction to Power BI: Overview of Power BI and its components, Installation and setup, Understanding the Power BI ecosystem, Importing data into Power BI
- Introducing Microsoft Power BI Desktop: Introduction to Microsoft power BI Desktop, Downloading the Microsoft Power BI Desktop, Power BI Desktop interface and workflow
- Connecting & Shaping Data: Power BI Front-End vs. Back-End, Types of Data Connectors, The Power Query Editor, Basic Table Transformations, Connecting to a Database, Extracting Data from the Web, Profiling Tools (Text Tools, Numerical Tools, Date & Time Tools), Change Type with Locale, Index, Conditional Columns and Calculated Column, Grouping & Aggregating, Pivoting & Unpivoting, Queries (Merging, appending, refreshing), Data Source Settings, Importing Excel model
- Creating a Data Model: Data Modeling, Database Normalization, Fact & Dimension tables, Primary & Foreign Keys, Relationships vs. Merged Tables, Creating, managing & editing Table Relationships, Star & Snowflake Schemas, Connecting Multiple Fact Tables, Filter Context & Filter Flow, Model Layouts, Data Formats & Categories, Creating Hierarchies
- Calculated fields with DAX: Data Analysis Expressions, DAX vs. M Languages, Intro to DAX Calculated Columns, Intro to DAX Measures, Implicit vs. Explicit Measures, Types of Measures (Quick Measures, Dedicated Measure Tables), Understanding Filter Context, DAX Syntax & Operators,
Common DAX Function Categories: Basic Math & Stats Functions, Counting Functions, Conditional & Logical Functions, The SWITCH Function, Common Text Functions, Basic Date & Time Functions, Calculate Function, All Function, Filter Function, Iterator Function, Joining Data with RELATED, DAX Measure Totals, Time Intelligence Patterns - Visualizing data with Reports: Dashboard Design Framework, Sketching the dashboard layout, Adding Report Pages & Objects, Naming & Grouping Objects, Cards (Multi-Row cards, KPI Cards, Top N Text Cards), Charts (Building Charts, Formatting Charts, Line Charts, Bar & Donut Charts, Gauge Charts, Area Charts), Trend Lines & Forecasts, Visuals (Table Visuals, Matrix Visuals, Map visuals, Importing Custom Visuals), Filterting (Basic Filtering Options, Top N Filtering), Formatting (Conditional formatting, Advanced Conditional Formatting), Parameters (Numeric Range Parameters, Fields Parameters), Slicers (Report Slicers, Slicer Panels), Drill Up & Drill Down, Editing Report Interactions, Adding Bookmarks, Custom Navigation Buttons, Managing & Viewing Roles, Mobile Layouts
- Power BI optimization tools: The Optimize Ribbon, Pausing Visuals, Optimization Presets, Applying All Slicers, Performance Analyzer, External Tools, Troubleshooting common issues in Power BI
- Real-world Projects and Case Studies: Hands-on projects using real-world datasets, Analyzing and visualizing data to derive actionable insights, Presenting analysis findings effectively
Maths & Statistics
- Arithmetic
- Weighted average
- Cumulative sum
- Percentile
- Vectors and Matrices
- Matrix Decompositions
- Vector Space
- Linear Mappings
- Eigenvalues and Eigenvectors
- Maxima and minima
- Mean value theorem
- Product and chain rule
- Derivatives
- Gradients of Matrices
- Taylor’s series
- Probability basics
- Probability distributions – Binomial
- Poisson
- Normal
- Bayes theorem
- Descriptive vs Inferential statistics
- Continuous vs Discrete data
- Nominal vs Ordinal data
- Mean, Median and Mode
- Standard Deviation and Variance
- Hypothesis testing: T-test, Paired T-test, p-value, F-Test, z-test
Database
- Introduction to MySQL
- Basic MySQL syntax
- Schema Design Methodology
- Create / Select / Drop / Copy of Database
- Create Table
- Constraints in MySQL
- Alter Table
- Insert / Select / Delete / Update Records
- Rollback, Commit and Grant
Machine Learning
- Handling NA values
- Outlier treatment
- Data normalization
- One hot encoding
- Label encoding
- Feature engineering
- Train test split
- Cross validation
- Types of ML: Supervised, Unsupervised
- Supervised: Regression, Classification, Linear models, Nonlinear models (tree-based models), Model evaluation
- Hyperparameter tunning: GridSearchCV, RandomSearchCV
- Unsupervised: K means, Hierarchical clustering, Dimensionality reduction (PCA)
Deep Learning
- What is a neural network?
- Forward propagation
- Back propagation
- Building multilayer perceptron
- Special neural network architectures: Convolutional neural network (CNN)
- Sequence models: RNN, LSTM
Natural Language Processing (NLP)
- Regex
- Text presentation: Count vectorizer, TF-IDF, BOW, Word2Vec, Embeddings
- Text classification: Naïve Bayes
- Fundamentals of Spacy & NLTP library
- One end to end project
Control Version
- Intro to VCS
- Types of VCS
- What is Git, GitHub
- Git Installation
- Configuring Git
- Connecting Git with GitHub
- Basic Git & GitHub Workflow
- Git Branching & Merging
- Git Clone
- Resolve Merge Conflict
- How to setup & upload Project on GitHub
- How to PUSH & Pull Project
Recent Posts


Request A Demo!
|
|
|
|
|
|
|
|
Sign In!
|
|
|
|